Strategic Asset Management: AspireBI
Multi-level financial and strategic impact evaluation of individual assets and groups, to identify sound options from reliable bases: the evidence base for long-term portfolio strategy right up to Board level.
- Audience
- Board · Exec
- Deployment
- Cloud · Azure UK
- Pairs with
- Asprey Assets · Sava Intelligent Energy
- Outputs
- NPV · Strategic value · Liability
- Flexible horizon
- Asset-level NPV
- Self-serve appraisal
- Sava-integrated
Strategic
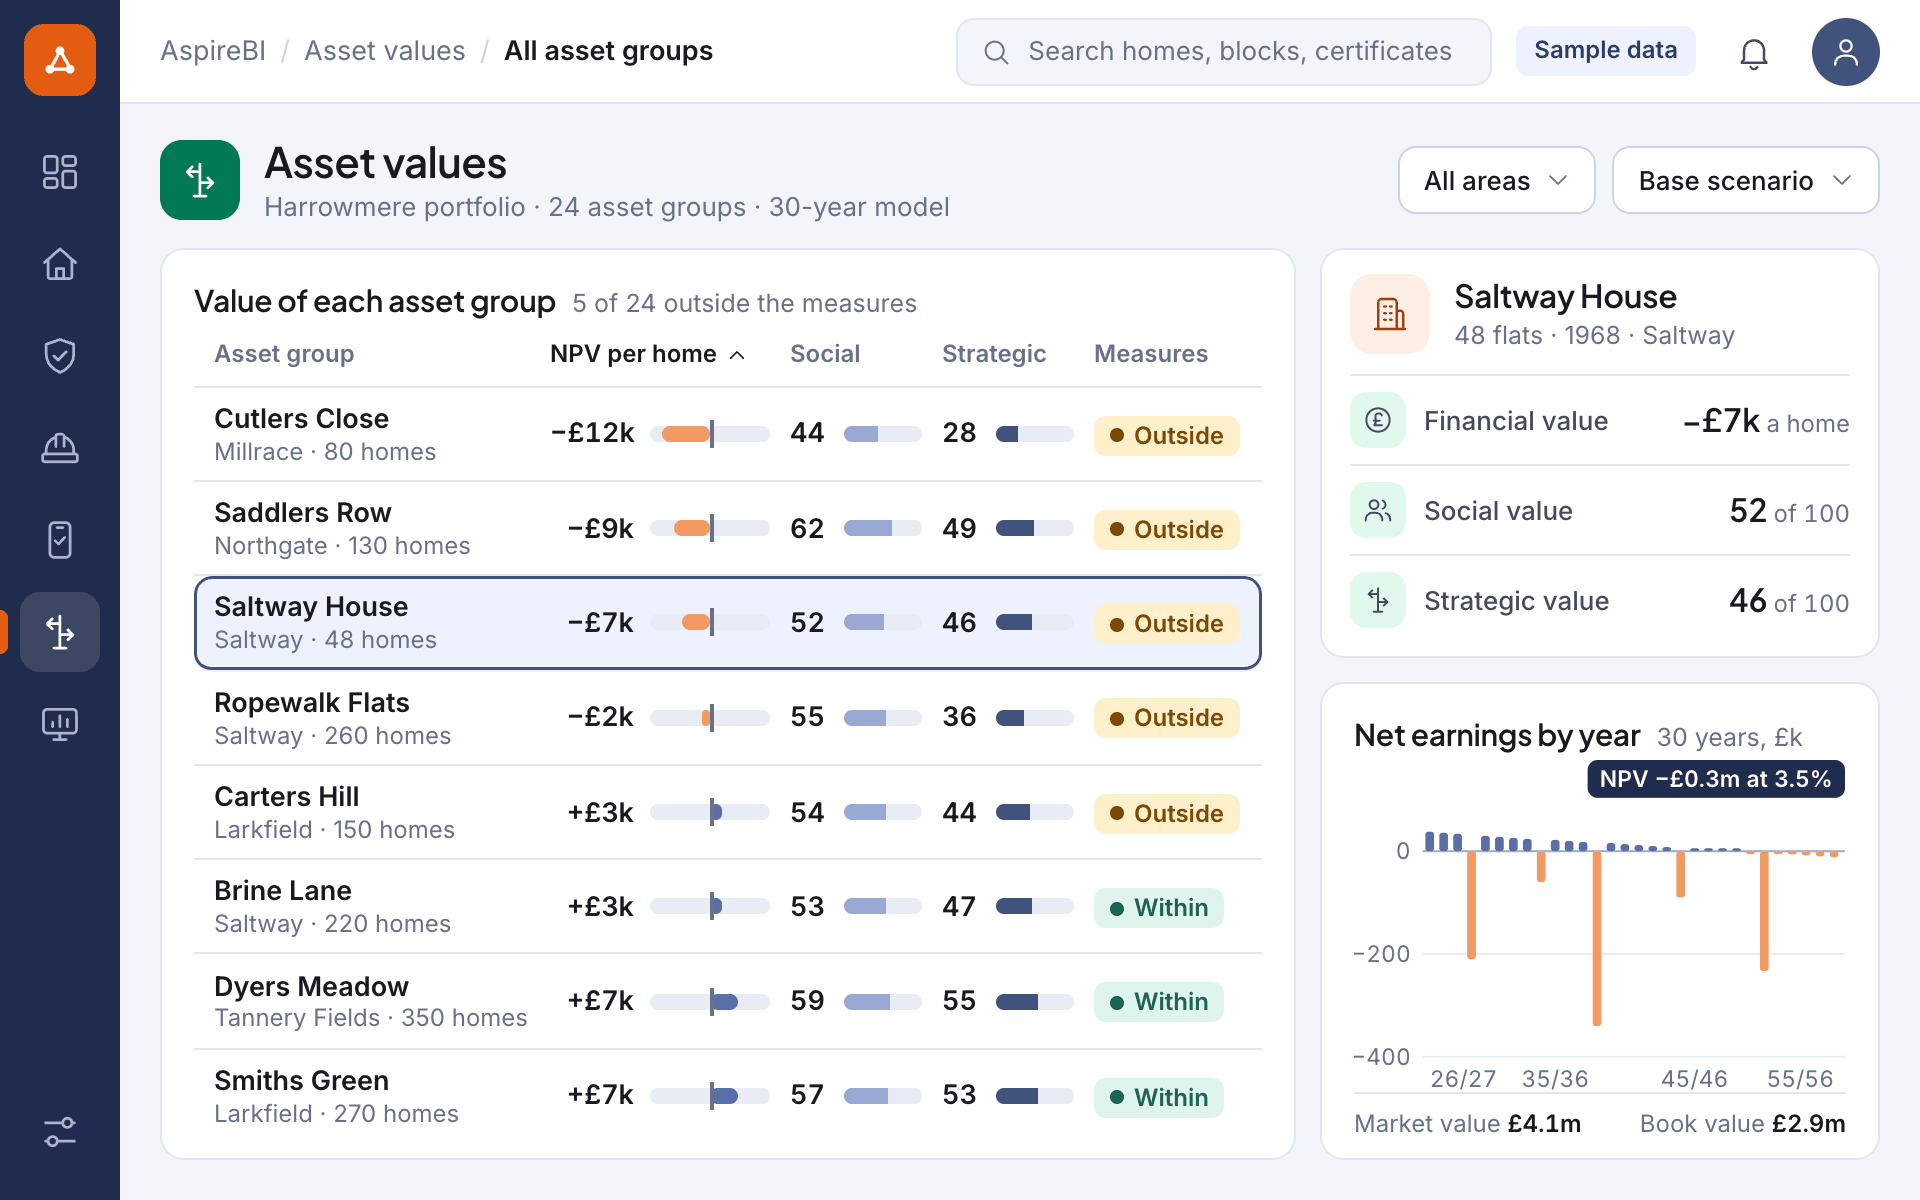
Financial, social and strategic values modelled for every asset
Strategic values
NPV
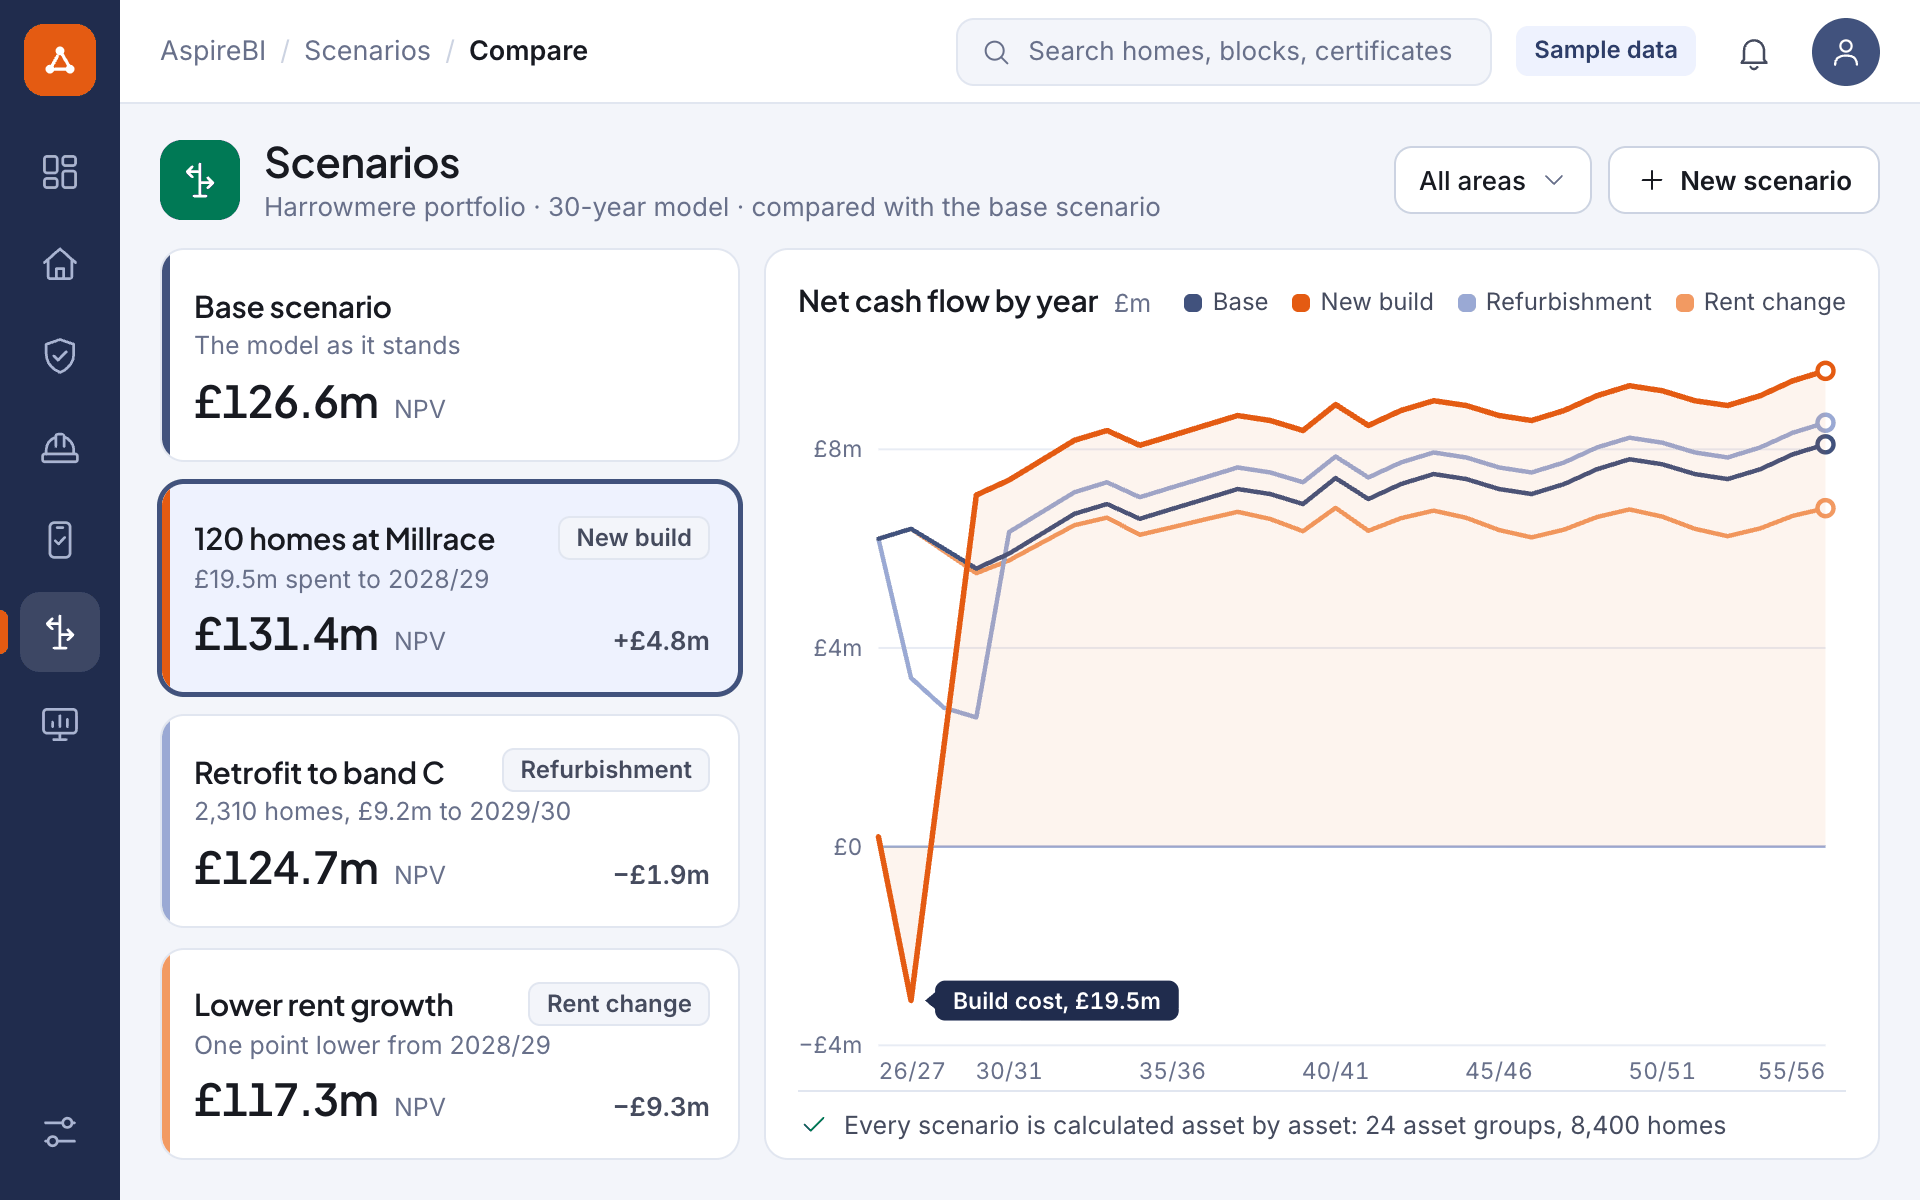
Net Present Value calculated for every individual asset, over a forecast horizon that flexes to your business needs
Asset-level granularity
Self-serve
A self-service model that your own team runs, which removes the reliance on repeated external appraisals
Self-serve appraisal
Why Strategic AM
Built for Boards that need defensible answers: not analyst-team backlogs
Four reasons strategic teams use AspireBI as their evidence base for portfolio-wide decisions.
Asset-level NPV
Every asset has its own NPV and a structured strategic-value score: surfaced consistently across the portfolio.
Structured option appraisal
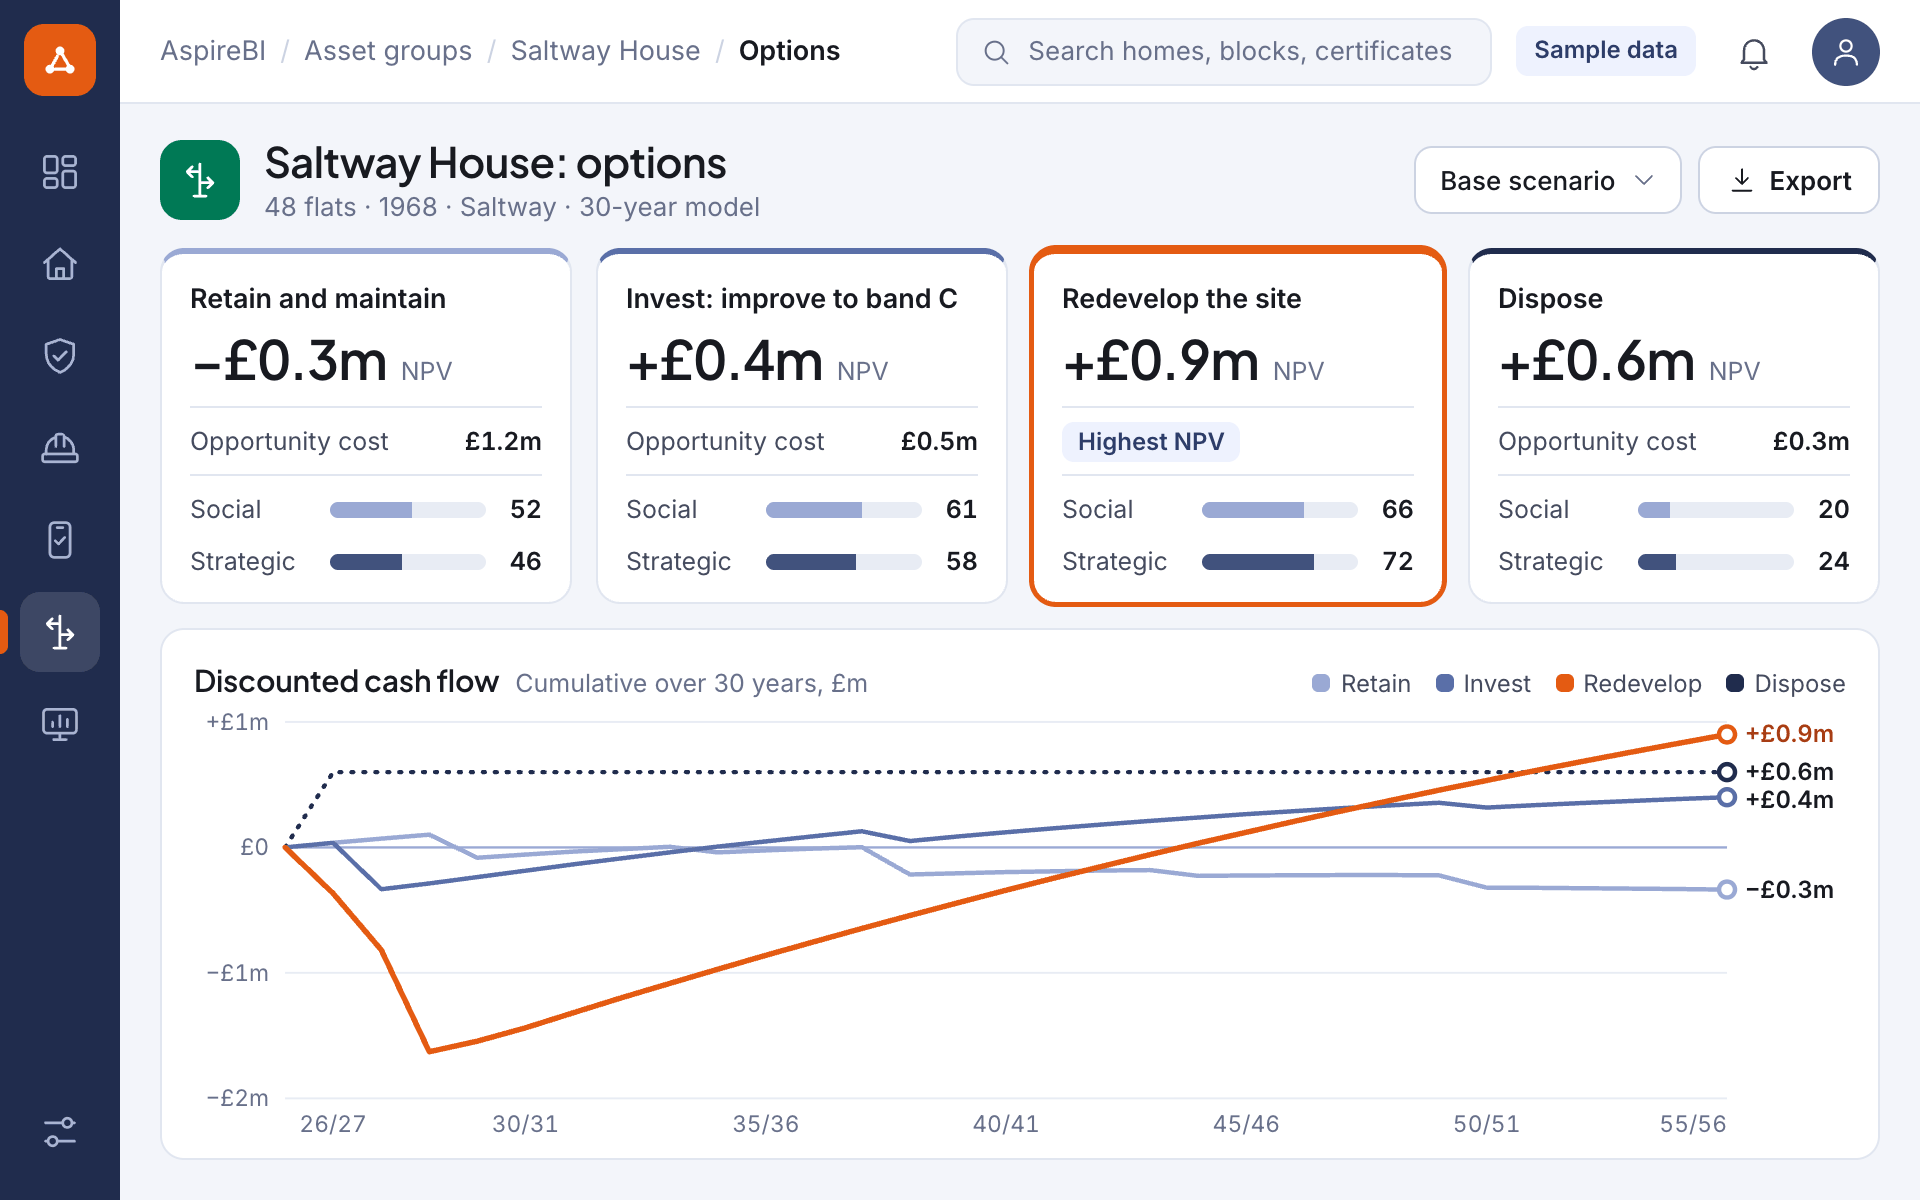
Competing investment options appraised against the same evidence base.
Modelling at every level
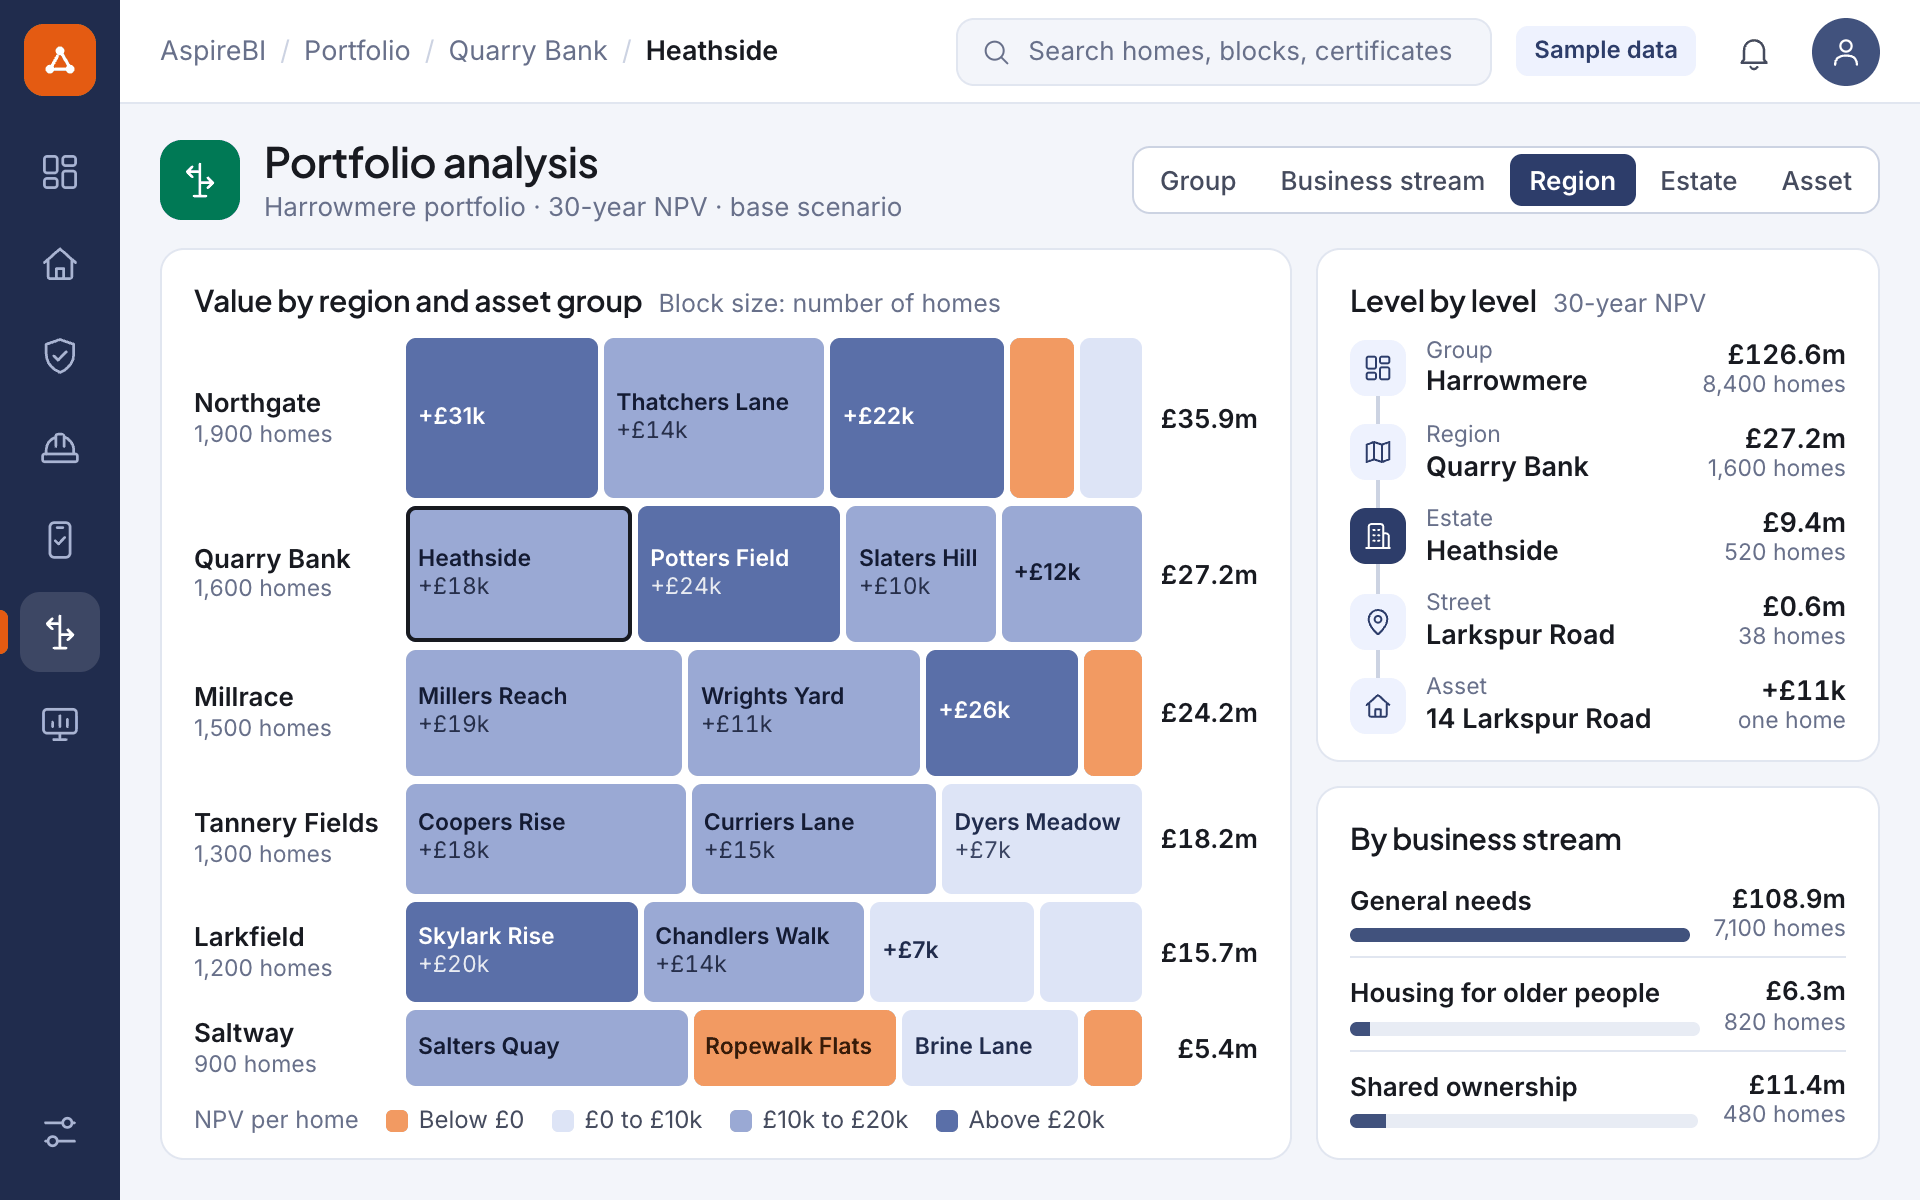
Asset-level calculations roll up to scheme, region and group: Board decisions grounded in the same data ops teams use.
Energy plans, modelled
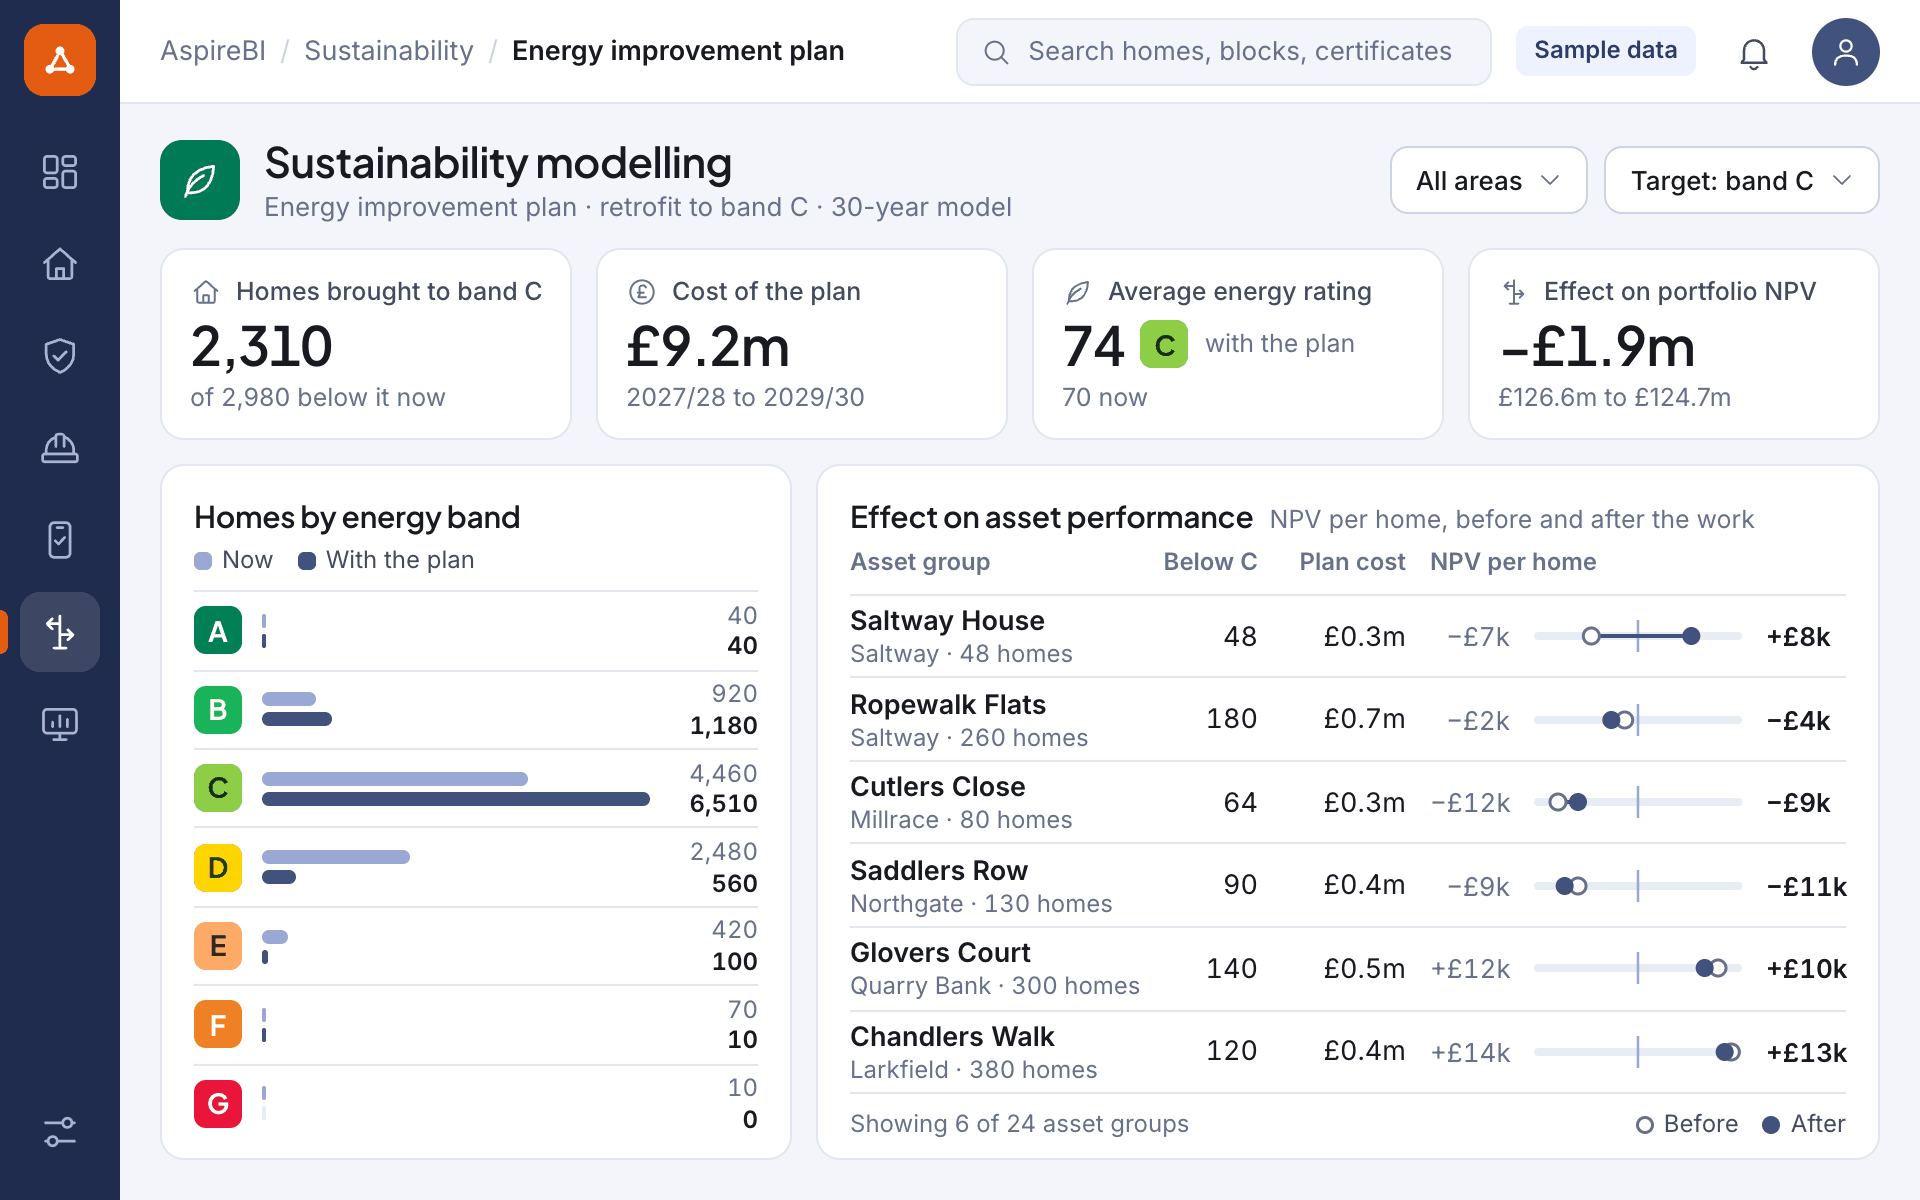
Sava-integrated sustainability investments sit inside the financial model, including their NPV impact, instead of running on a parallel sheet.
What it does
From individual asset, to whole portfolio: one consistent model
AspireBI calculates each asset’s financial and strategic values, supports structured option appraisal across the whole stock, and models future scenarios with asset-level calculations to inform long-term portfolio strategy.
Outcomes
- Shared understanding across the organisation
- Clearer insight into stock performance & value
- Removes reliance on expensive third-party appraisals
- Defensible business cases for regulators
- Evidence-based decisions on investment and divestment
- Substantial elements of asset and liability register requirements
How it joins up
Strategic insight: built on operational truth
AspireBI doesn’t run on a separate spreadsheet world. It is a central model that draws its data from several sources.
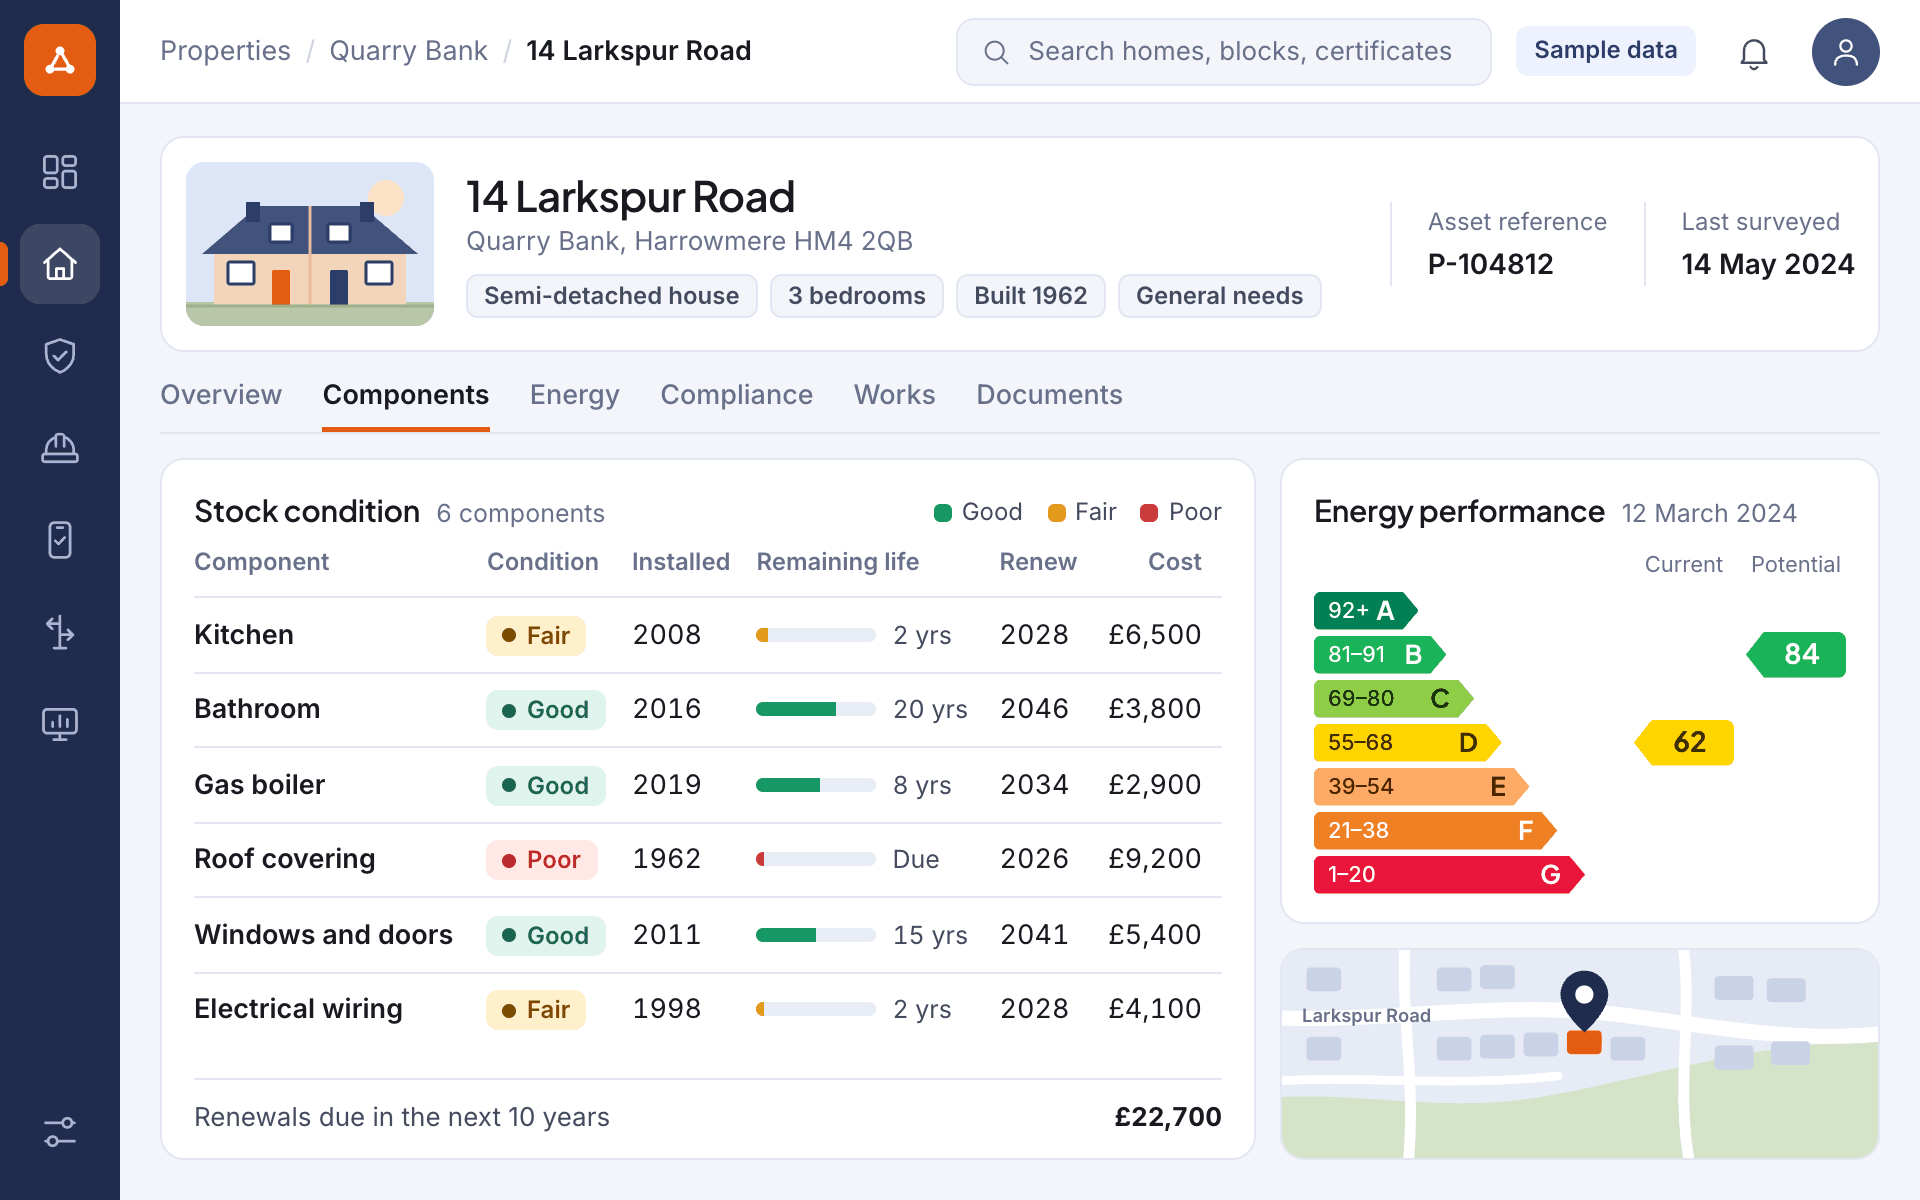
Asprey Assets: operational data feed.
Sava Intelligent Energy models efficiency and SAP impact directly into the financial story.
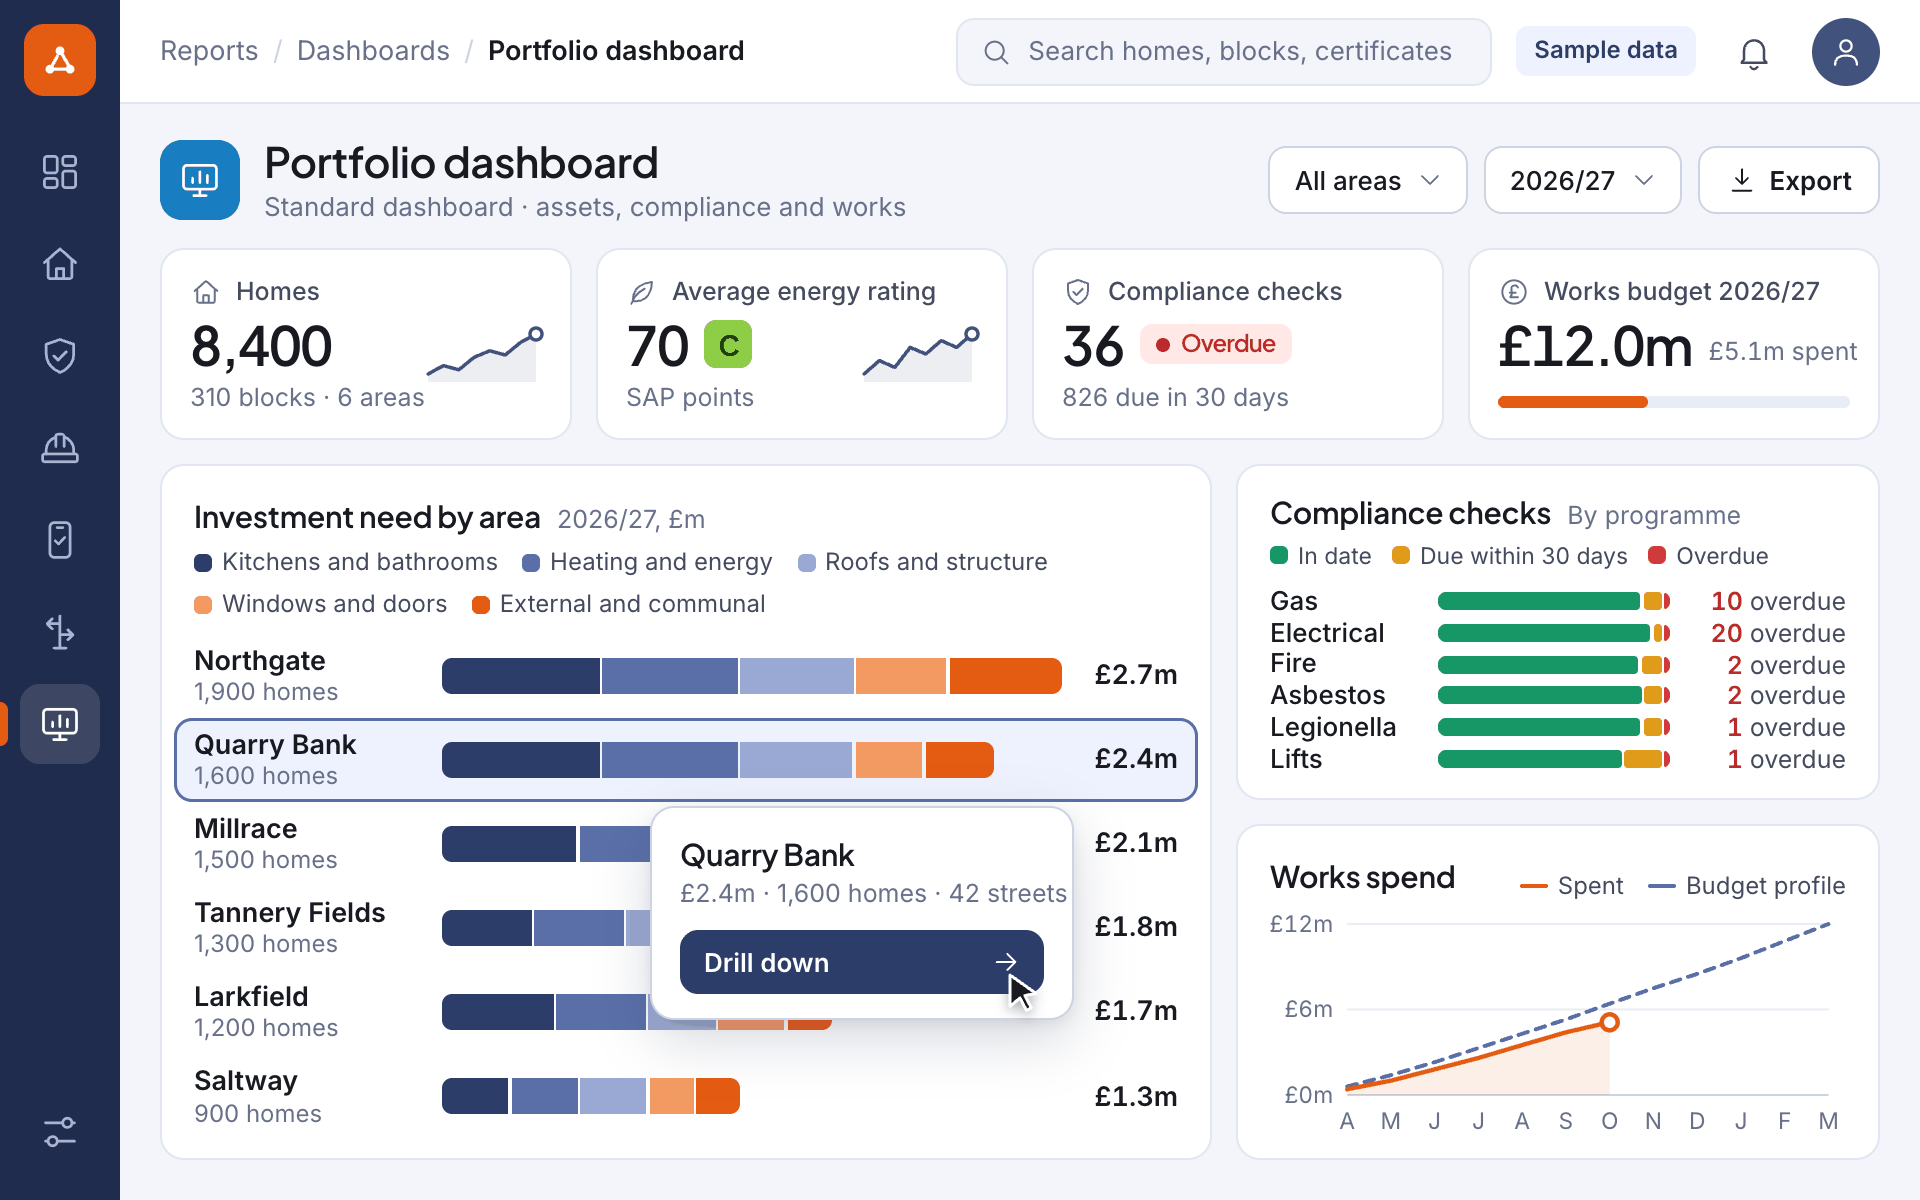
Power BI dashboards: self-service analytics and reporting.
- Asprey Assets
- Sava Intelligent Energy
- Board pack
- Power BI dashboards
Decision support: built in
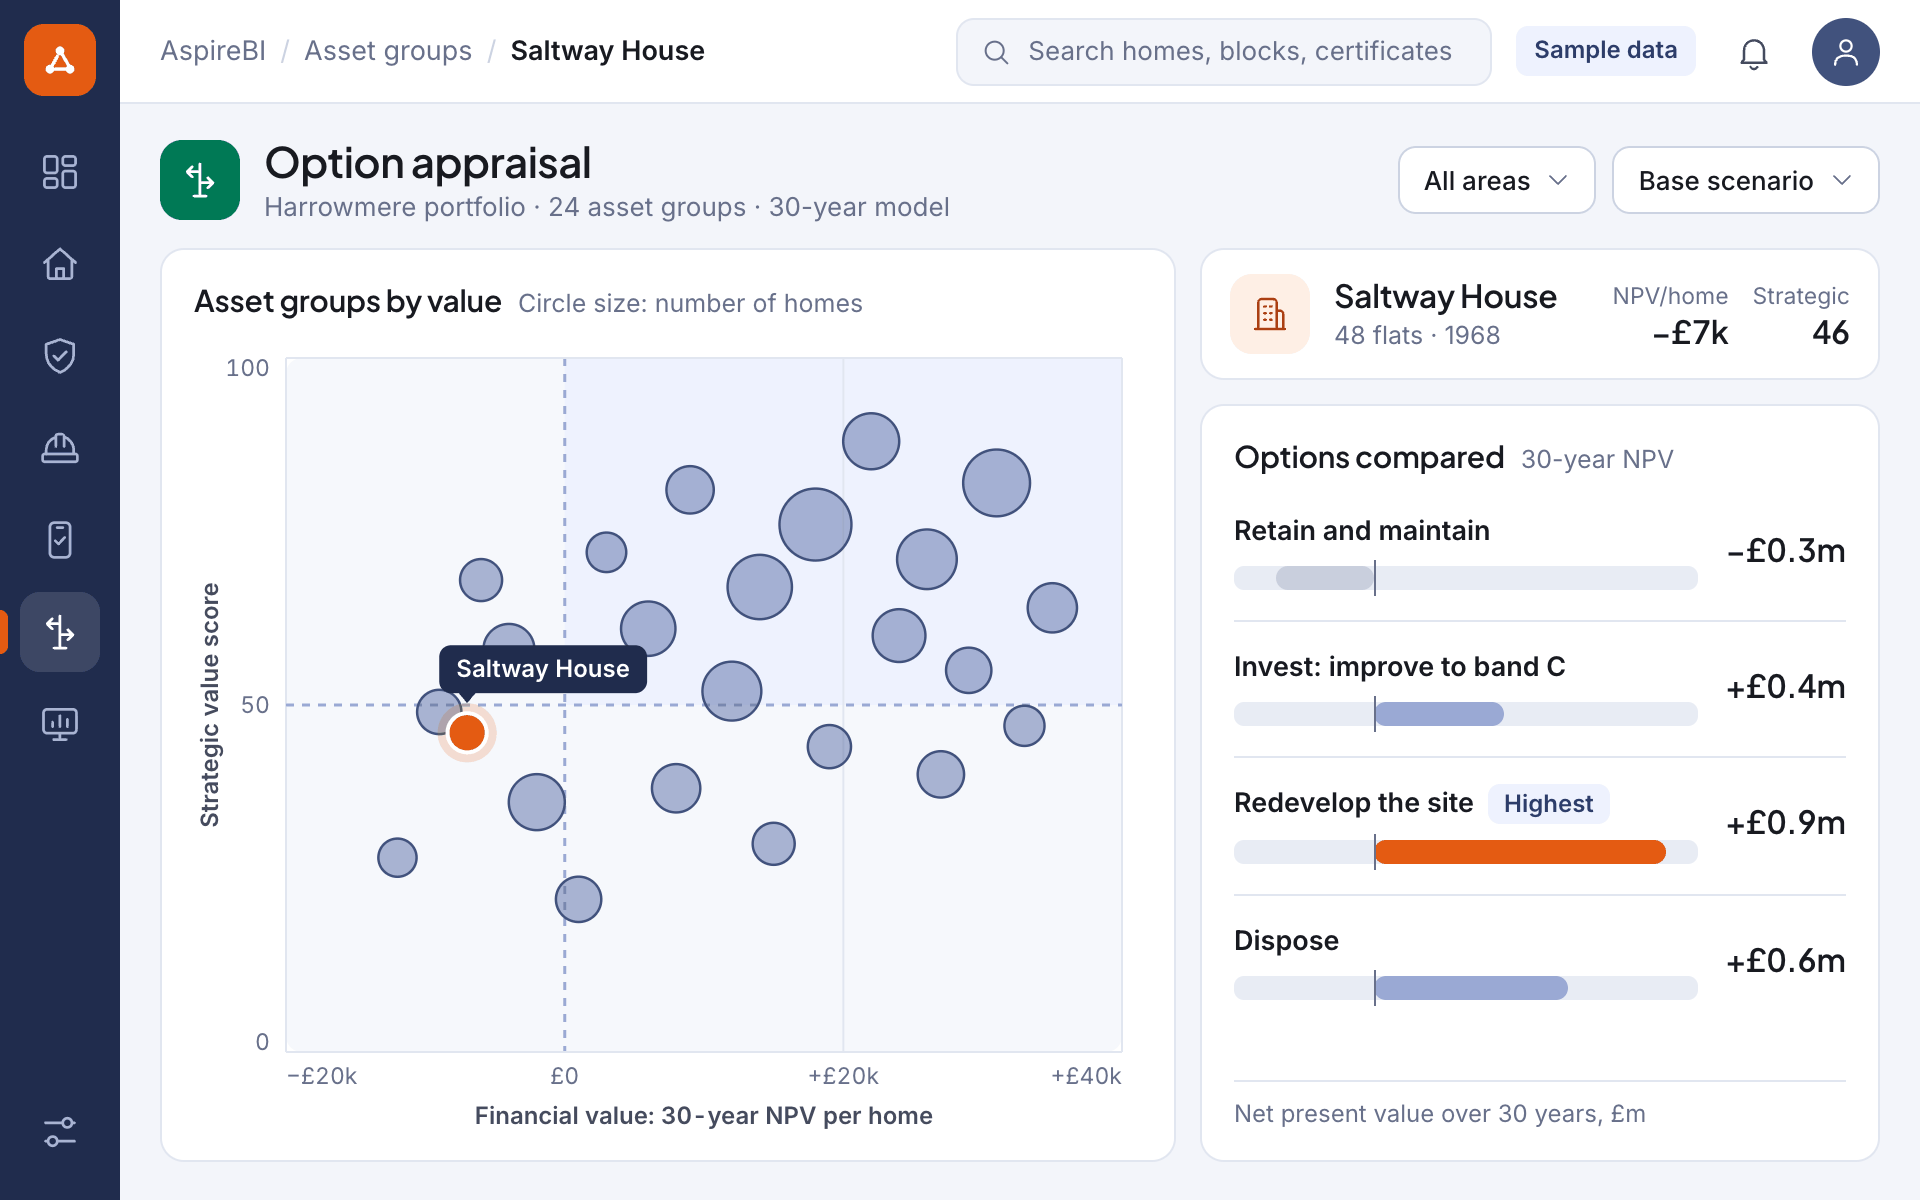
One scheme, its options: appraised against the same evidence base
Every option scored on financial and strategic value.
Customer outcome: Metropolitan Thames Valley Housing
“The AspireBI platform now provides a central source of income and expenditure information to assess the financial and strategic performance of properties (residential and non-residential) at individual, streets, estates, regions and group level.”

Pairs well with